New CellPhoneDB v5 results
2025-03-31
vignette_v5.rmd![]()
![]()
![]()
![]()
CellPhoneDB v5 results
From version 5 of CellPhoneDB,
there are two new output files - interaction_scores and
CellSign.
According to the official repository, this table corresponds to:
interaction_scores: stores the new score generated. This
score ranges from 0-100.
To score interactions CellPhoneDB v5 employs the following protocol:
- Exclude genes not participating in any interaction and those expressed in less than k% of cells within a given cell type.
- Calculate the mean expression (G) of each gene (i) within each cell type (j).
- For heteromeric proteins, aggregate the mean gene expression of each subunit (n) employing the geometric mean.
- Scale mean gene/heteromer expression across cell types between 0 and 100.
- Calculate the product of the scale mean expression of the interaction proteins as a proxy of the interaction relevance.
cellsign: accepts the new CellSign
data.
The aim of the CellSign module is to identify activated receptors and
prioritise high-confidence interactions by leveraging the activity of
the downstream transcription factors (TFs). CellSign relies on a
database of receptors linked to their putative downstream TFs. This is a
binary table where 1 means it’s a hit. In
ktplots/ktplotspy, we convert all other values to 0.5 adn
fit it to the alpha parameter for visualisation.
ktplots will support these output via inclusion into the
existing plot_cpdb function. We will gradually enable their
functionality across the other functions, as well as with in the python
package eventually.
Load packages
library(ktplots)
data(cpdb_output_v5)

plot_cpdb_heatmap(pvals = relevant_interactions_v5, degs_analysis = TRUE, title = "Sum of significant interactions")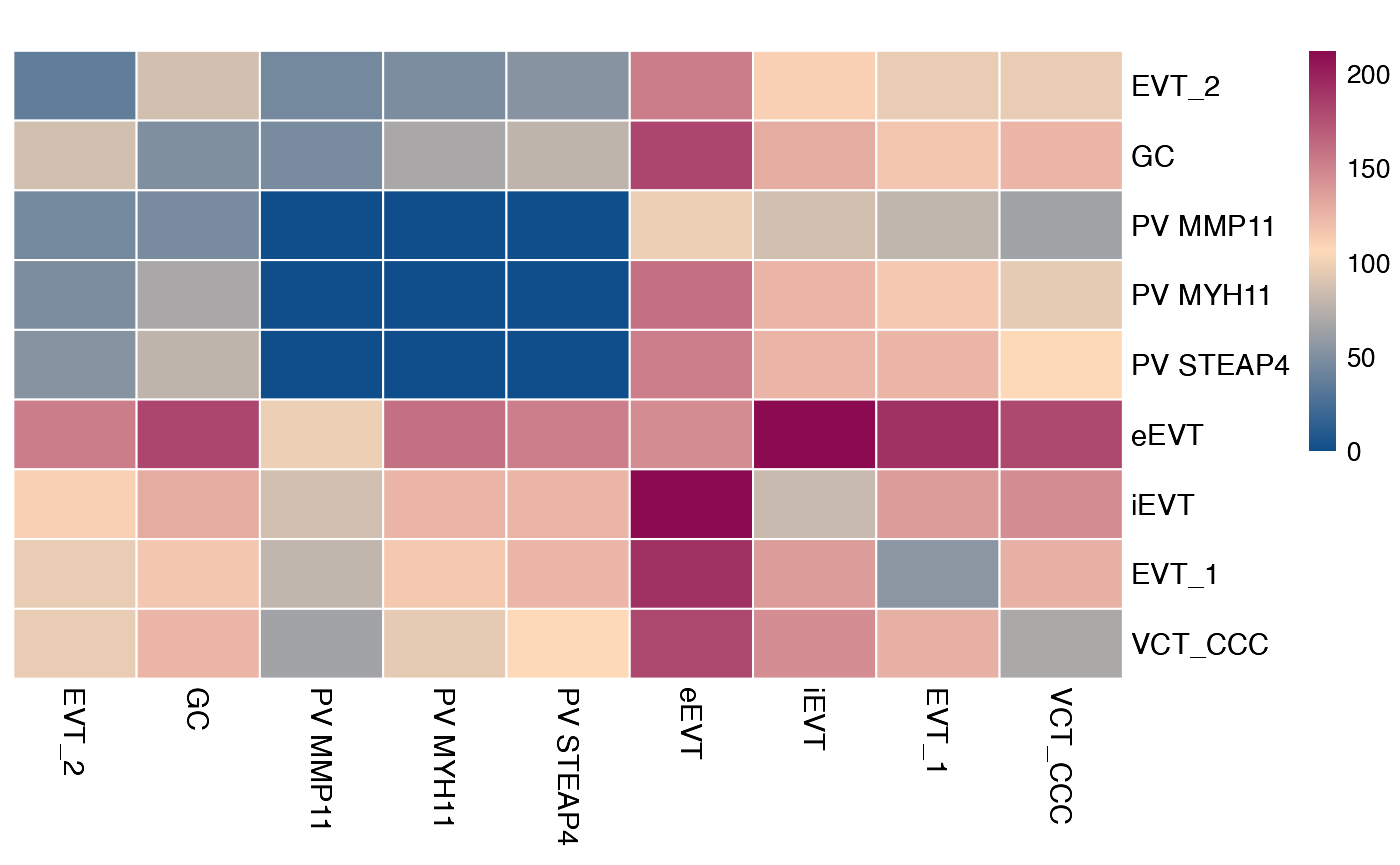
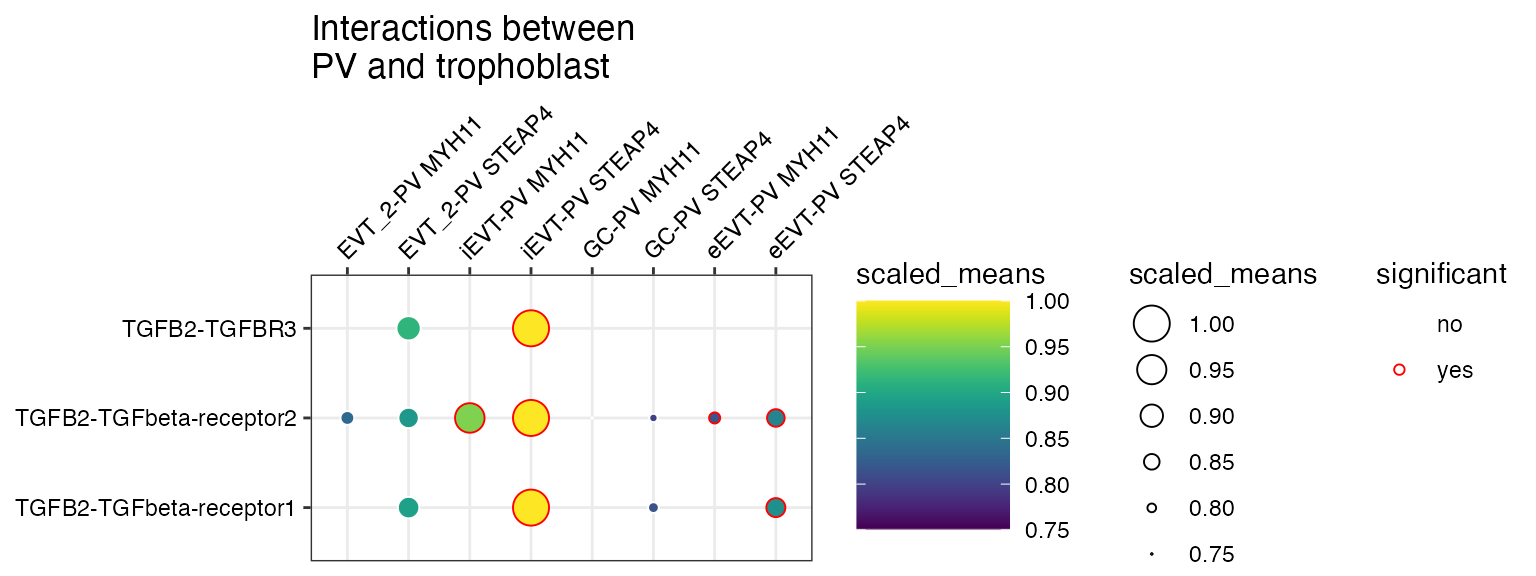
plot_cpdb(
    scdata = sce_v5,
    cell_type1 = "PV MYH11|PV STEAP4|PV MMPP11",
    cell_type2 = "EVT_1|EVT_2|GC|iEVT|eEVT|VCT_CCC",
    means = means_v5,
    pvals = relevant_interactions_v5,
    celltype_key = "cell_labels",
    genes = c("TGFB2", "CSF1R"),
    title = "Interactions between PV and trophoblast ",
    max_size = 6,
    highlight_size = 0.75,
    degs_analysis = TRUE,
    standard_scale = TRUE
)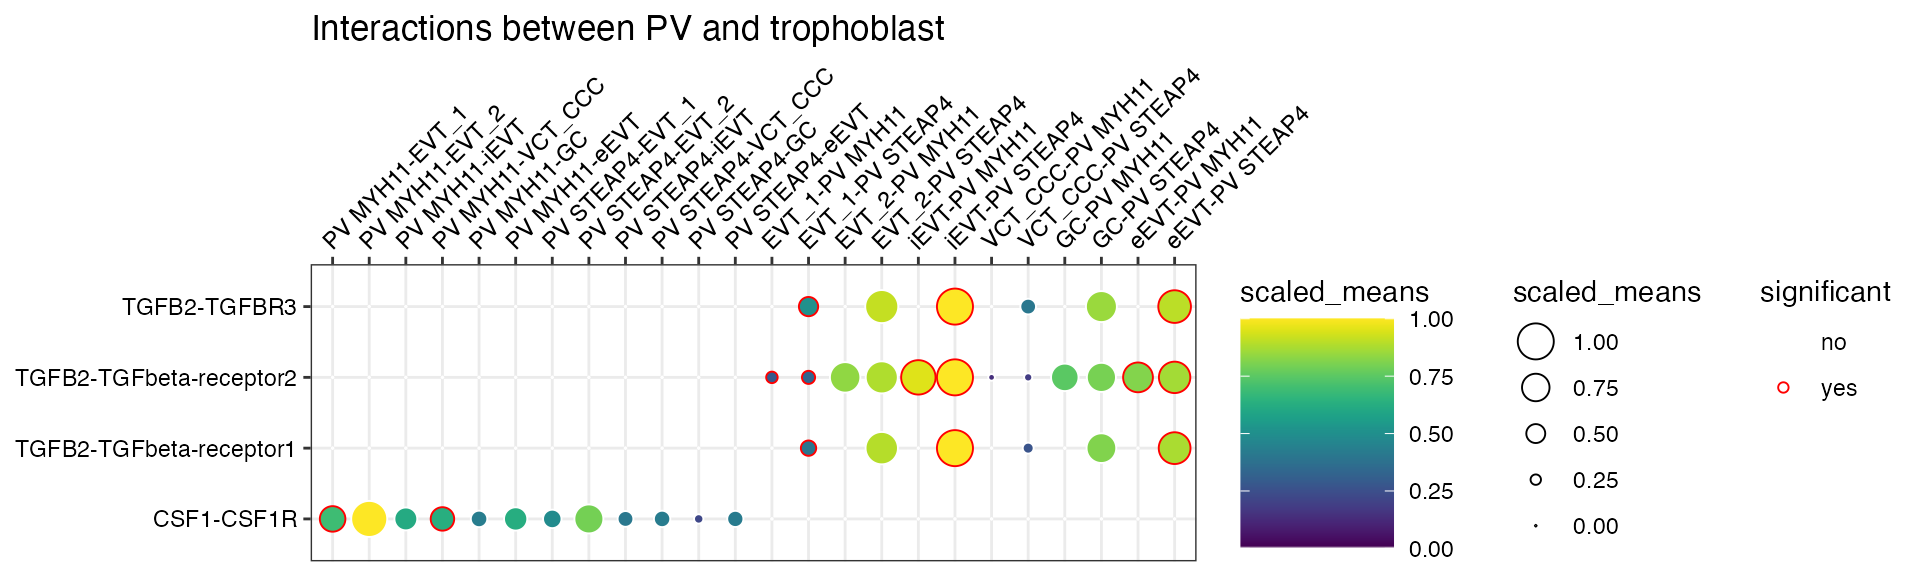
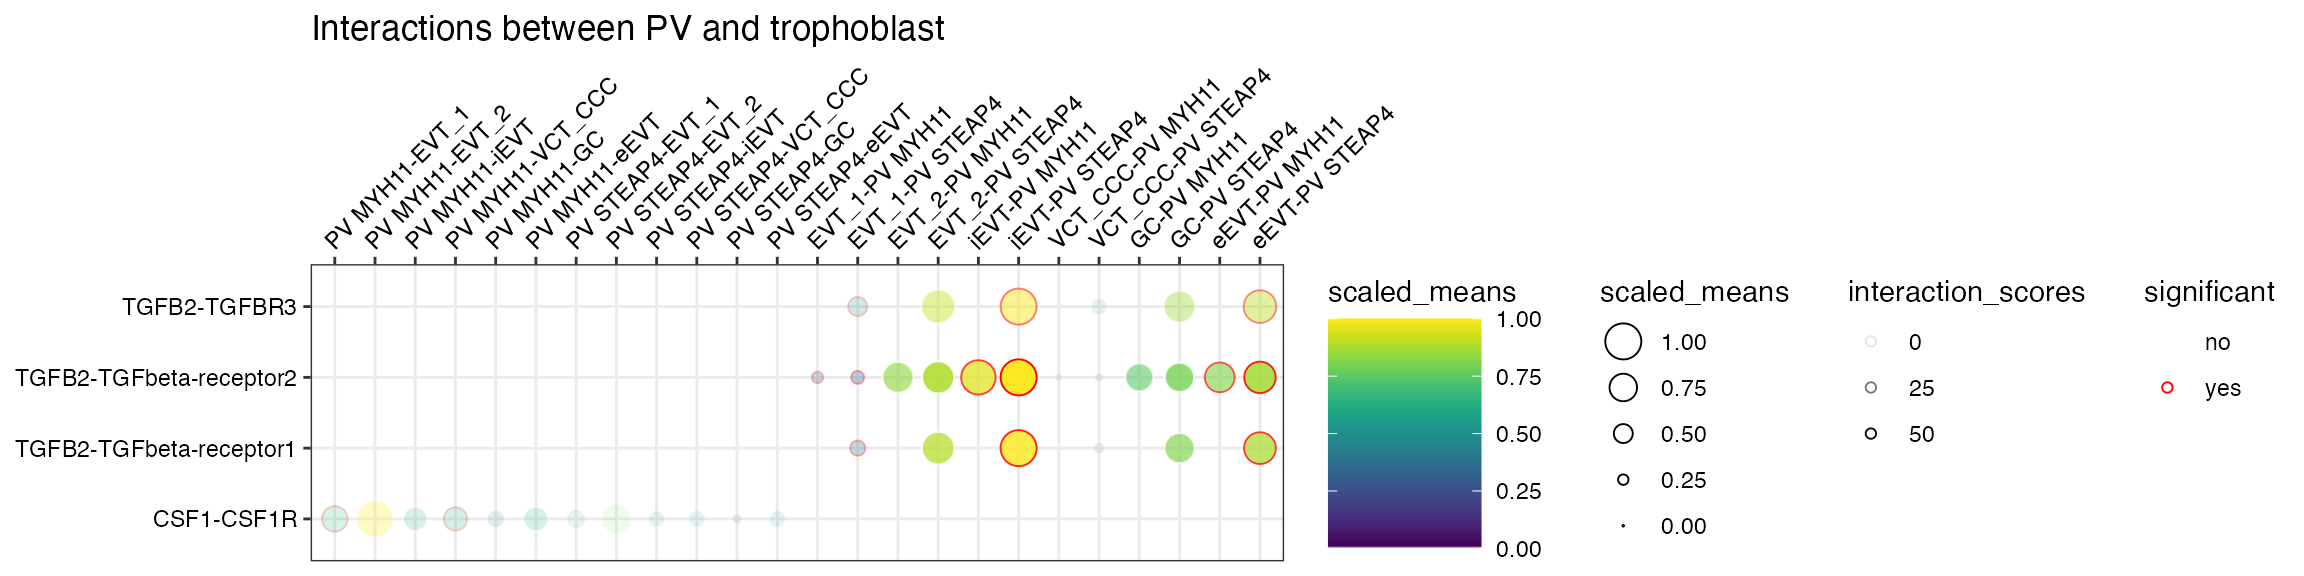
Interaction scores
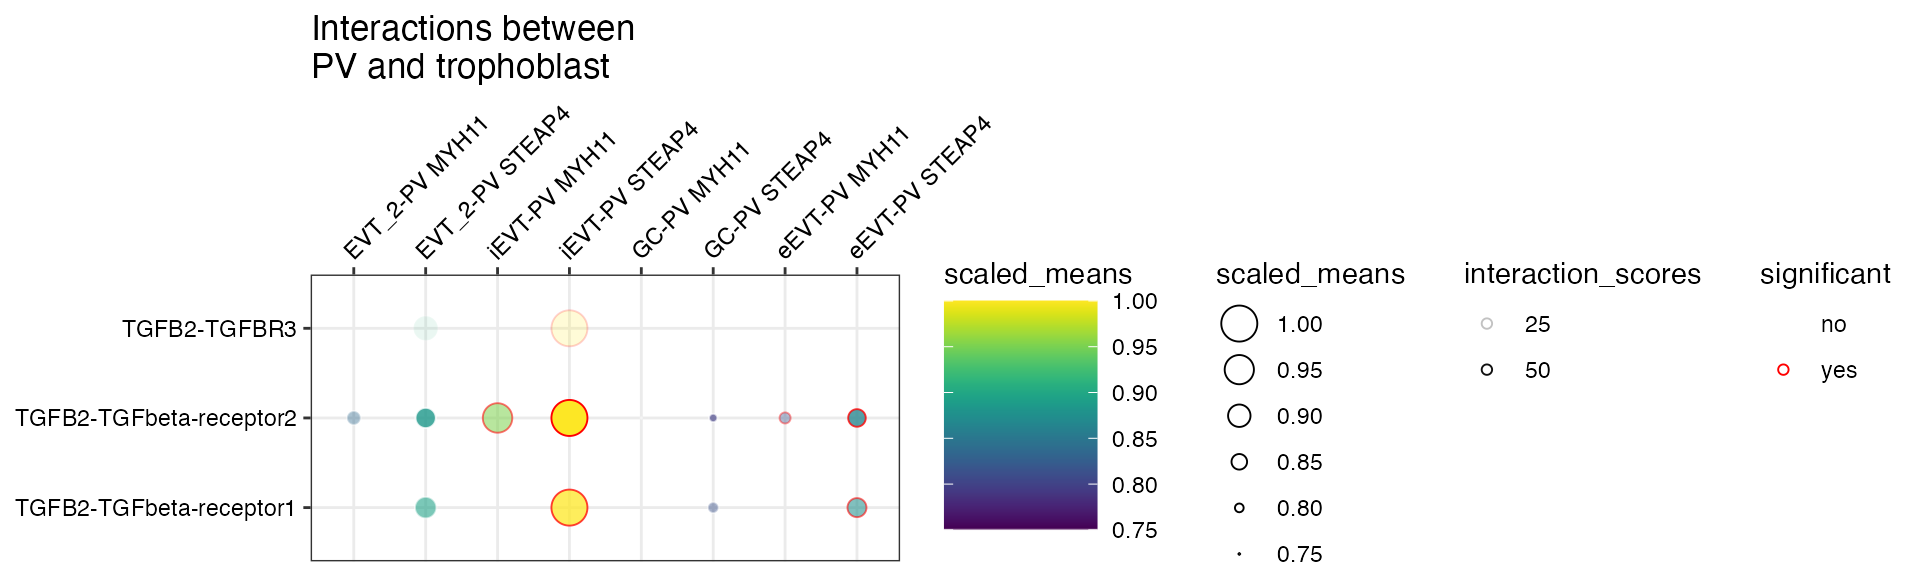
Let’s start with interaction scores. If a dataframe corresponding to
the interaction_scores file is provided, you can toggle the
alpha transparency of the interactions by the interaction score
(interaction ranking is simply the score/100).
plot_cpdb(
    scdata = sce_v5,
    cell_type1 = "PV MYH11|PV STEAP4|PV MMPP11",
    cell_type2 = "EVT_1|EVT_2|GC|iEVT|eEVT|VCT_CCC",
    means = means_v5,
    pvals = relevant_interactions_v5,
    celltype_key = "cell_labels",
    genes = c("TGFB2", "CSF1R"),
    title = "Interactions between PV and trophoblast ",
    max_size = 6,
    highlight_size = 0.75,
    degs_analysis = TRUE,
    standard_scale = TRUE,
    interaction_scores = interaction_scores_v5,
    scale_alpha_by_interaction_scores = TRUE
)
You can also specify a minimum interaction score to keep, removing all interactions lesser than this value.
plot_cpdb(
    scdata = sce_v5,
    cell_type1 = "PV MYH11|PV STEAP4|PV MMPP11",
    cell_type2 = "EVT_1|EVT_2|GC|iEVT|eEVT|VCT_CCC",
    means = means_v5,
    pvals = relevant_interactions_v5,
    celltype_key = "cell_labels",
    genes = c("TGFB2", "CSF1R"),
    title = "Interactions between\nPV and trophoblast ",
    max_size = 6,
    highlight_size = 0.75,
    degs_analysis = TRUE,
    standard_scale = TRUE,
    interaction_scores = interaction_scores_v5,
    min_interaction_score = 20
)
or specify both to have the alpha transparency shown too.
plot_cpdb(
    scdata = sce_v5,
    cell_type1 = "PV MYH11|PV STEAP4|PV MMPP11",
    cell_type2 = "EVT_1|EVT_2|GC|iEVT|eEVT|VCT_CCC",
    means = means_v5,
    pvals = relevant_interactions_v5,
    celltype_key = "cell_labels",
    genes = c("TGFB2", "CSF1R"),
    title = "Interactions between\nPV and trophoblast ",
    max_size = 6,
    highlight_size = 0.75,
    degs_analysis = TRUE,
    standard_scale = TRUE,
    interaction_scores = interaction_scores_v5,
    scale_alpha_by_interaction_scores = TRUE,
    min_interaction_score = 20
)
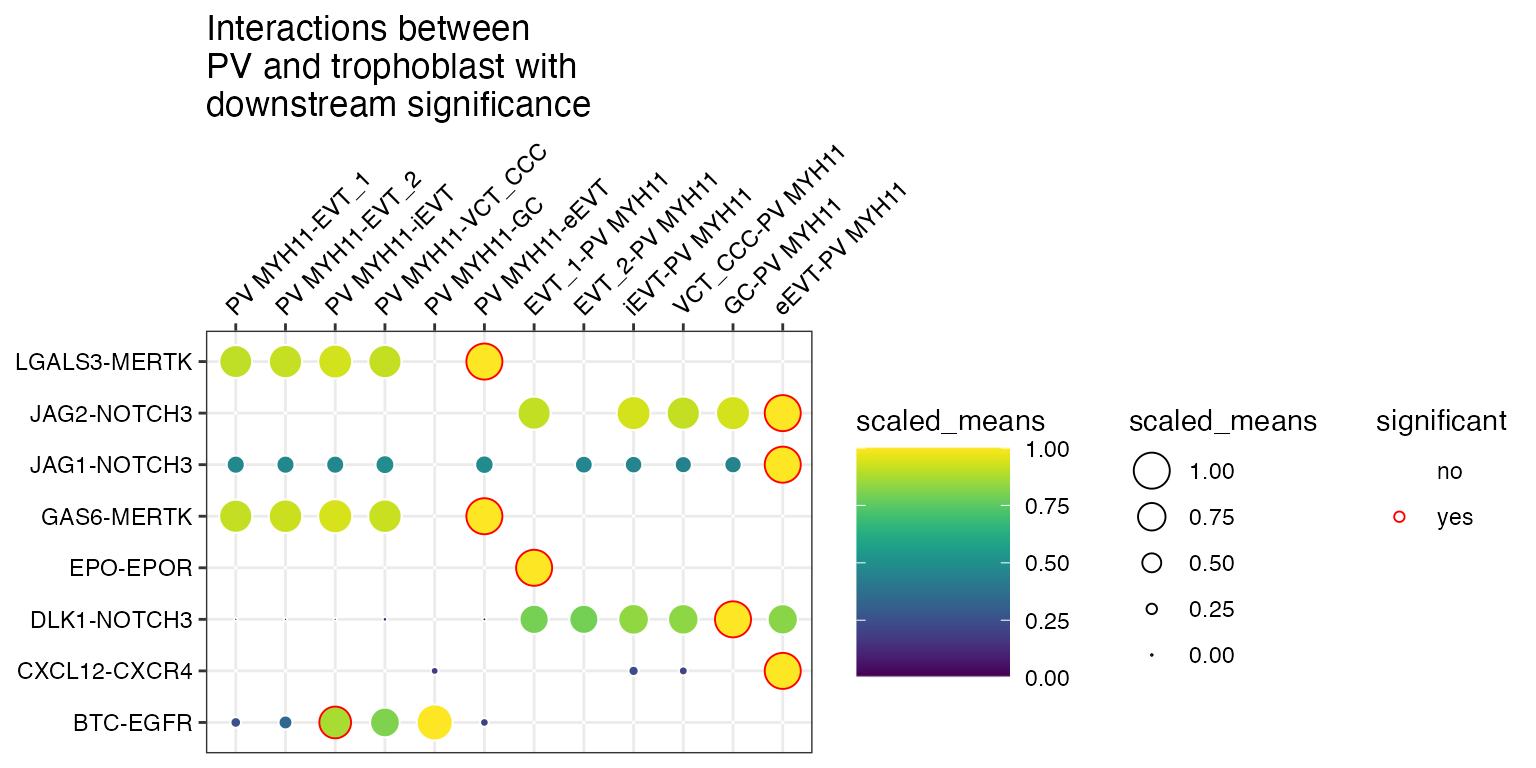
CellSign
If a dataframe corresponding to the cellsign file is
provided, you can toggle the filter the interactions by the results
plot_cpdb(
    scdata = sce_v5,
    cell_type1 = "PV MYH11",
    cell_type2 = "EVT_1|EVT_2|GC|iEVT|eEVT|VCT_CCC",
    means = means_v5,
    pvals = relevant_interactions_v5,
    celltype_key = "cell_labels",
    title = "Interactions between\nPV and trophoblast with\ndownstream significance",
    max_size = 6,
    highlight_size = 0.75,
    degs_analysis = TRUE,
    standard_scale = TRUE,
    cellsign = cellsign_v5,
    filter_by_cellsign = TRUE
)
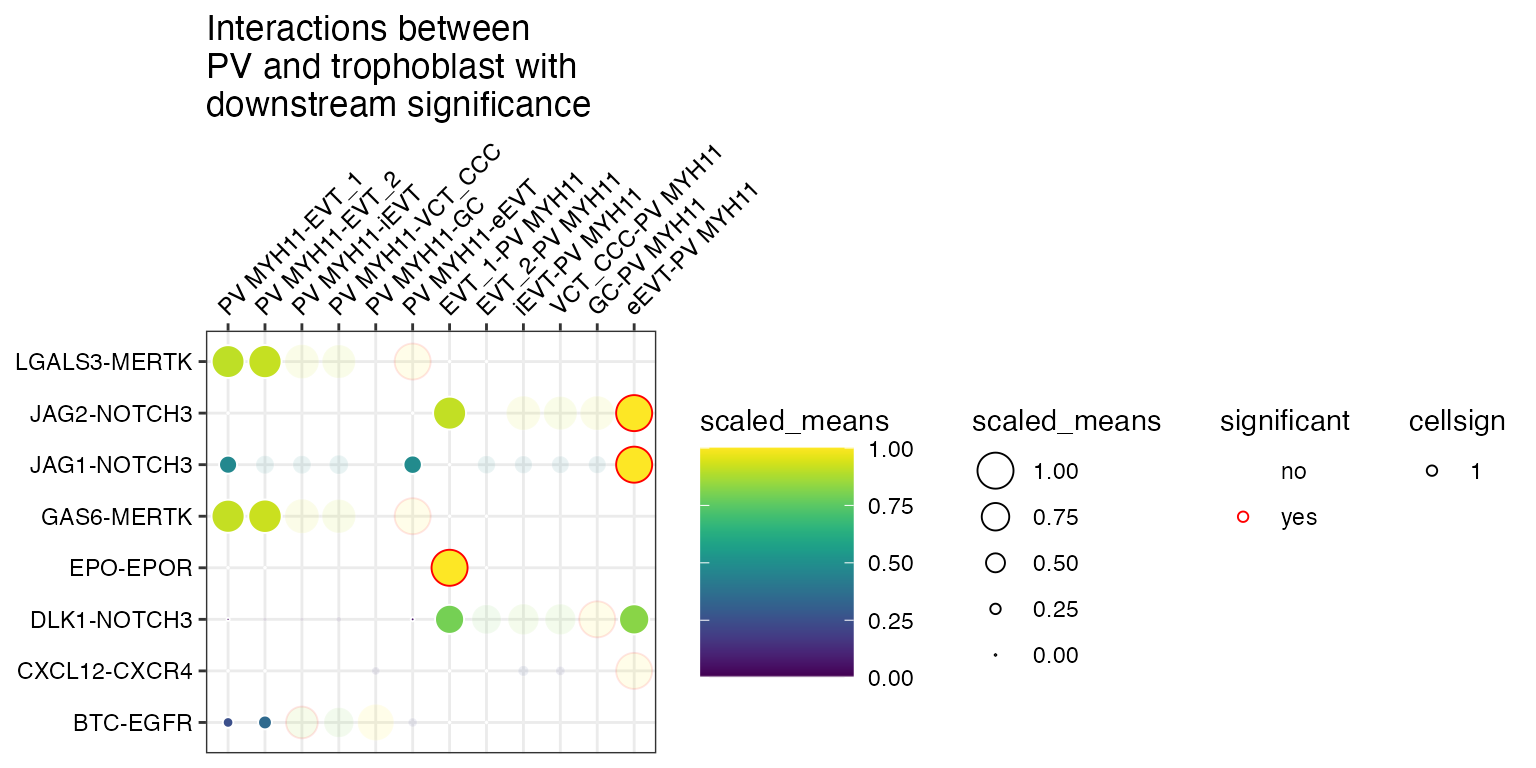
and also scale the alpha value (50% for 0 and 100% for 1).
plot_cpdb(
    scdata = sce_v5,
    cell_type1 = "PV MYH11",
    cell_type2 = "EVT_1|EVT_2|GC|iEVT|eEVT|VCT_CCC",
    means = means_v5,
    pvals = relevant_interactions_v5,
    celltype_key = "cell_labels",
    title = "Interactions between\nPV and trophoblast with\ndownstream significance",
    max_size = 6,
    highlight_size = 0.75,
    degs_analysis = TRUE,
    standard_scale = TRUE,
    cellsign = cellsign_v5,
    filter_by_cellsign = TRUE,
    scale_alpha_by_cellsign = TRUE
)
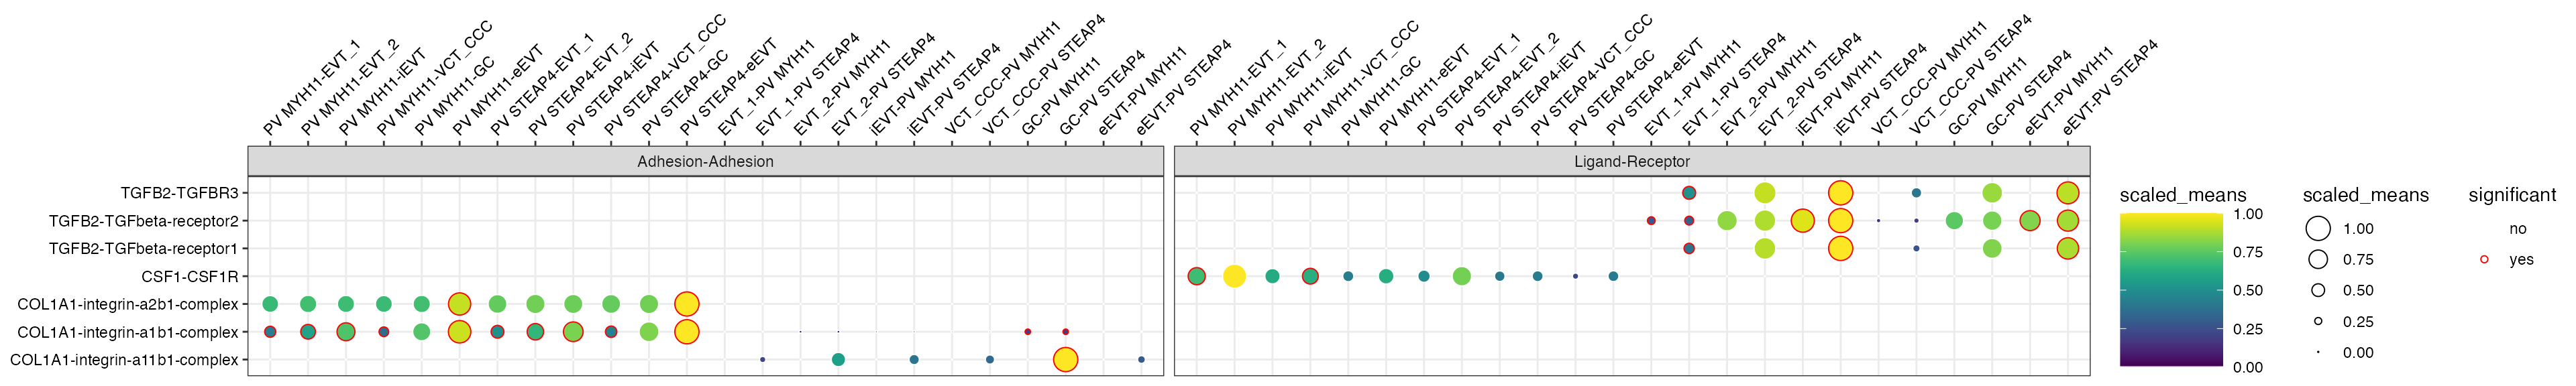
Additional plotting data
From now on, is_integrin, directionality
and classification are transferred to final output table in
plot_cpdb. This means you will be able to use something
like facet_grid/facet_wrap to plot them!
library(ggplot2)
p <- plot_cpdb(
    scdata = sce_v5,
    cell_type1 = "PV MYH11|PV STEAP4|PV MMPP11",
    cell_type2 = "EVT_1|EVT_2|GC|iEVT|eEVT|VCT_CCC",
    means = means_v5,
    pvals = relevant_interactions_v5,
    celltype_key = "cell_labels",
    genes = c("TGFB2", "CSF1R", "COL1A1"),
    max_size = 6,
    highlight_size = 0.75,
    degs_analysis = TRUE,
    standard_scale = TRUE,
    interaction_scores = interaction_scores_v5
    # return_table = TRUE
)
p + facet_wrap(~classification, ncol = 3)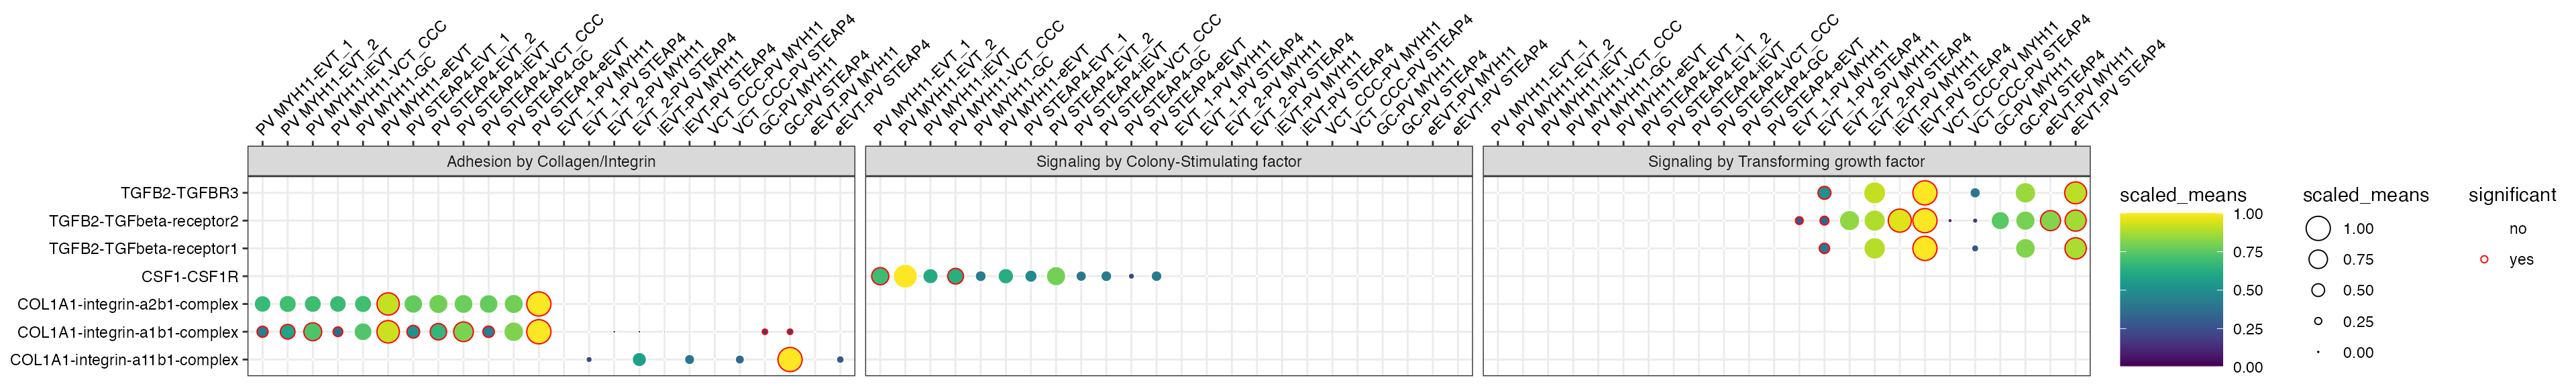
p + facet_wrap(~ classification + is_integrin, ncol = 3)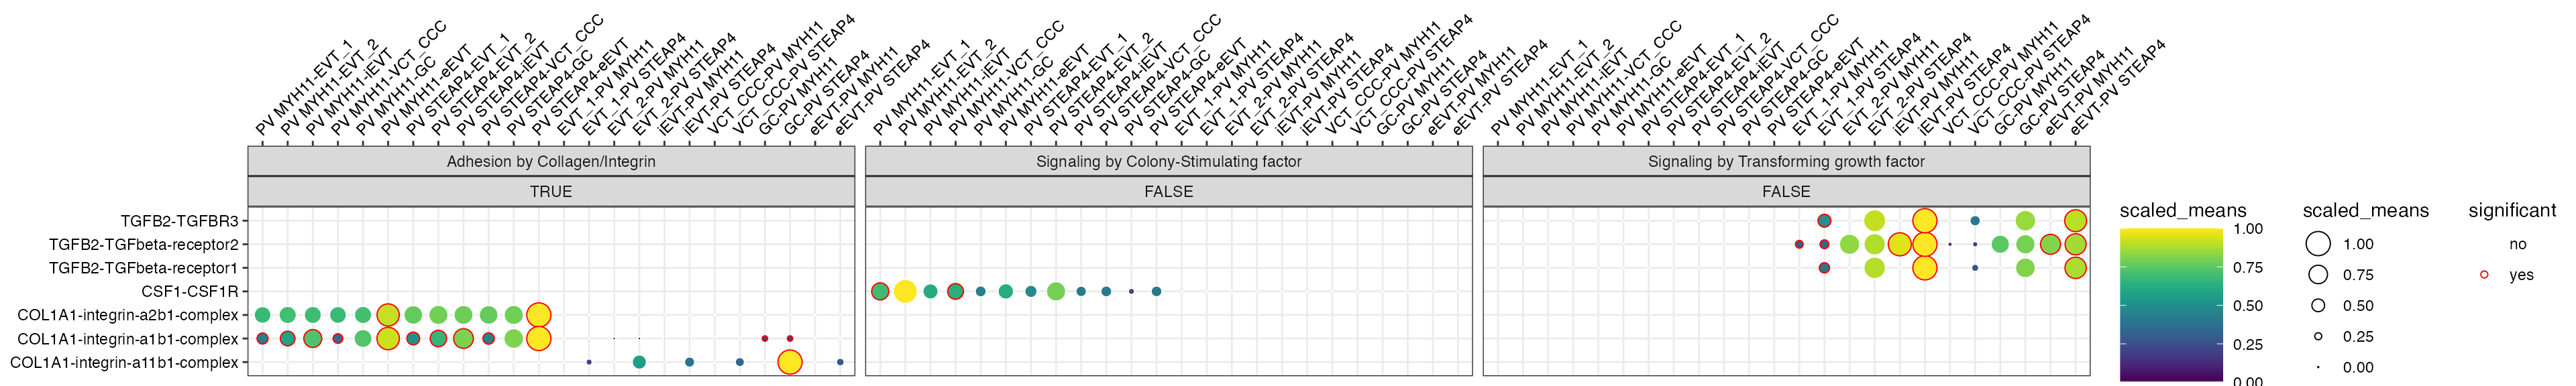
p + facet_wrap(~directionality, ncol = 2)