Plotting CellPhoneDB results
plot_cpdb.RdPlotting CellPhoneDB results
plot_cpdb(
  scdata,
  cell_type1,
  cell_type2,
  celltype_key,
  means,
  pvals,
  interaction_scores = NULL,
  cellsign = NULL,
  max_size = 8,
  keep_significant_only = TRUE,
  splitby_key = NULL,
  gene_family = NULL,
  custom_gene_family = NULL,
  genes = NULL,
  standard_scale = TRUE,
  cluster_rows = TRUE,
  col_option = viridis::viridis(50),
  default_style = TRUE,
  highlight_col = "red",
  highlight_size = NULL,
  max_highlight_size = 2,
  special_character_regex_pattern = NULL,
  degs_analysis = FALSE,
  return_table = FALSE,
  exclude_interactions = NULL,
  min_interaction_score = 0,
  scale_alpha_by_interaction_scores = FALSE,
  scale_alpha_by_cellsign = FALSE,
  filter_by_cellsign = FALSE,
  title = "",
  keep_id_cp_interaction = FALSE,
  result_precision = 3,
  ...
)
Arguments
- scdata
single-cell data. can be Seurat/SingleCellExperiment object
- cell_type1
Name of cell type 1. Accepts regex pattern.
- cell_type2
Name of cell type 2. Accepts regex pattern.
- celltype_key
Column name in metadata/colData storing the celltype annotations. Values in this column should match the second column of the input `meta.txt` used for CellPhoneDB.
- means
Data frame corresponding to `means.txt` from CellPhoneDB.
- pvals
Data frame corresponding to `pvalues.txt` or `relevant_interactions.txt` from CellPhoneDB.
- interaction_scores
Data frame corresponding to `interaction_scores.txt` from CellPhoneDB version 5 onwards.
- cellsign
Data frame corresponding to `CellSign.txt` from CellPhoneDB version 5 onwards.
- max_size
max size of points.
- keep_significant_only
logical. Default is TRUE. Switch to FALSE if you want to plot all the results from cpdb.
- splitby_key
column name in the metadata/coldata table to split the spots by. Can only take columns with binary options. If specified, name to split by MUST be specified in the meta file provided to cpdb prior to analysis.
- gene_family
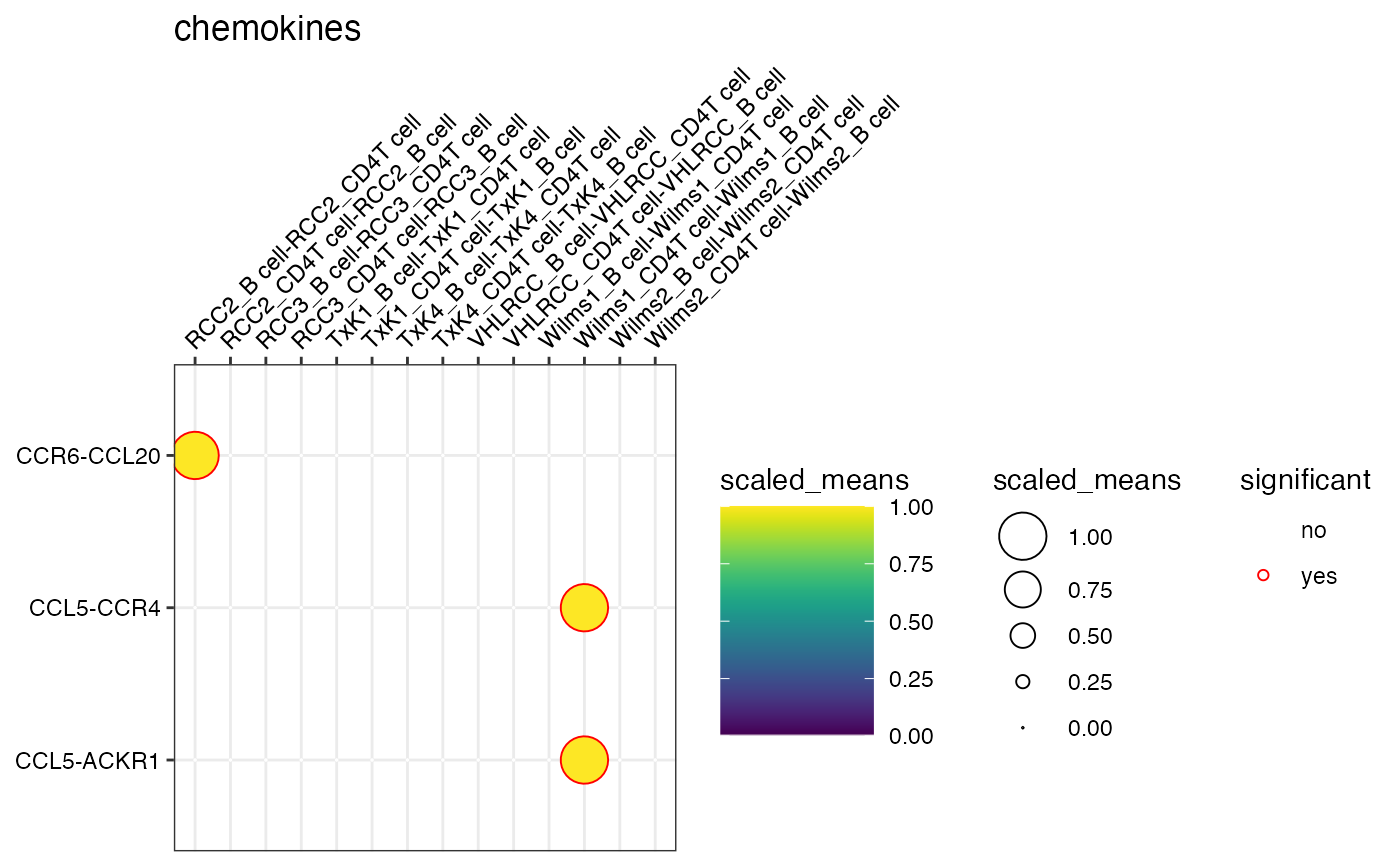
default = NULL. some predefined group of genes. can take one (or several) of these default options: 'chemokines', 'Th1', 'Th2', 'Th17', 'Treg', 'costimulatory', 'coinhibitory', 'niche'. Also accepts name(s) of custom gene families.
- custom_gene_family
default = NULL. If provided, will update the gene_family function with this custom entry. Both `gene_family` (name of the custom family) and `custom_gene_family` must be specified for this to work. Provide either a data.frame with column names as name of family and genes in rows or a named likes like : list('customfamily' = c('genea', 'geneb', 'genec'))
- genes
default = NULL. can specify custom list of genes if gene_family is NULL
- standard_scale
logical. scale the expression to range from 0 to 1. NULL defaults to FALSE.
- cluster_rows
logical. whether or not to cluster the rows.
- col_option
specify plotting colours
- default_style
default = TRUE. Show all mean values and trace significant interactions with `higlight` colour. If FALSE, significant interactions will be presented as a white ring.
- highlight_col
colour for highlighting p <0.05
- highlight_size
stroke size for highlight if p < 0.05. if NULL, scales to -log10(pval).
- max_highlight_size
max size of stroke for highlight.
- special_character_regex_pattern
search pattern if the cell type names contains special character. NULL defaults to '/|:|\?|\*|\+|[\]|\(|\)'.
- degs_analysis
if is CellPhoneDB degs_analysis mode.
- return_table
whether or not to return as a table rather than to plot.
- exclude_interactions
if provided, the interactions will be removed from the output.
- min_interaction_score
Filtering the interactions shown by including only those above the given interaction score.
- scale_alpha_by_interaction_scores
Whether or not to filter values by the interaction score.
- scale_alpha_by_cellsign
Whether or not to filter the transparency of interactions by the cellsign.
- filter_by_cellsign
Filter out interactions with a 0 value cellsign.
- keep_id_cp_interaction
Whether or not to keep the id_cp_interaction in the plot.
- result_precision
Sets integer value for decimal points of p_value, default to 3
- ...
passes arguments to grep for cell_type1 and cell_type2.
Value
ggplot dot plot object of cellphone db output
Examples
# \donttest{
data(kidneyimmune)
data(cpdb_output)
plot_cpdb(kidneyimmune, "B cell", "CD4T cell", "celltype", means, pvals, splitby_key = "Experiment", genes = c("CXCL13", "CD274", "CXCR5"))
#> No significant genes found and plotting will not proceed.
#> [1] NA
plot_cpdb(kidneyimmune, "B cell", "CD4T cell", "celltype", means, pvals, splitby_key = "Experiment", gene_family = "chemokines")

# }
# }