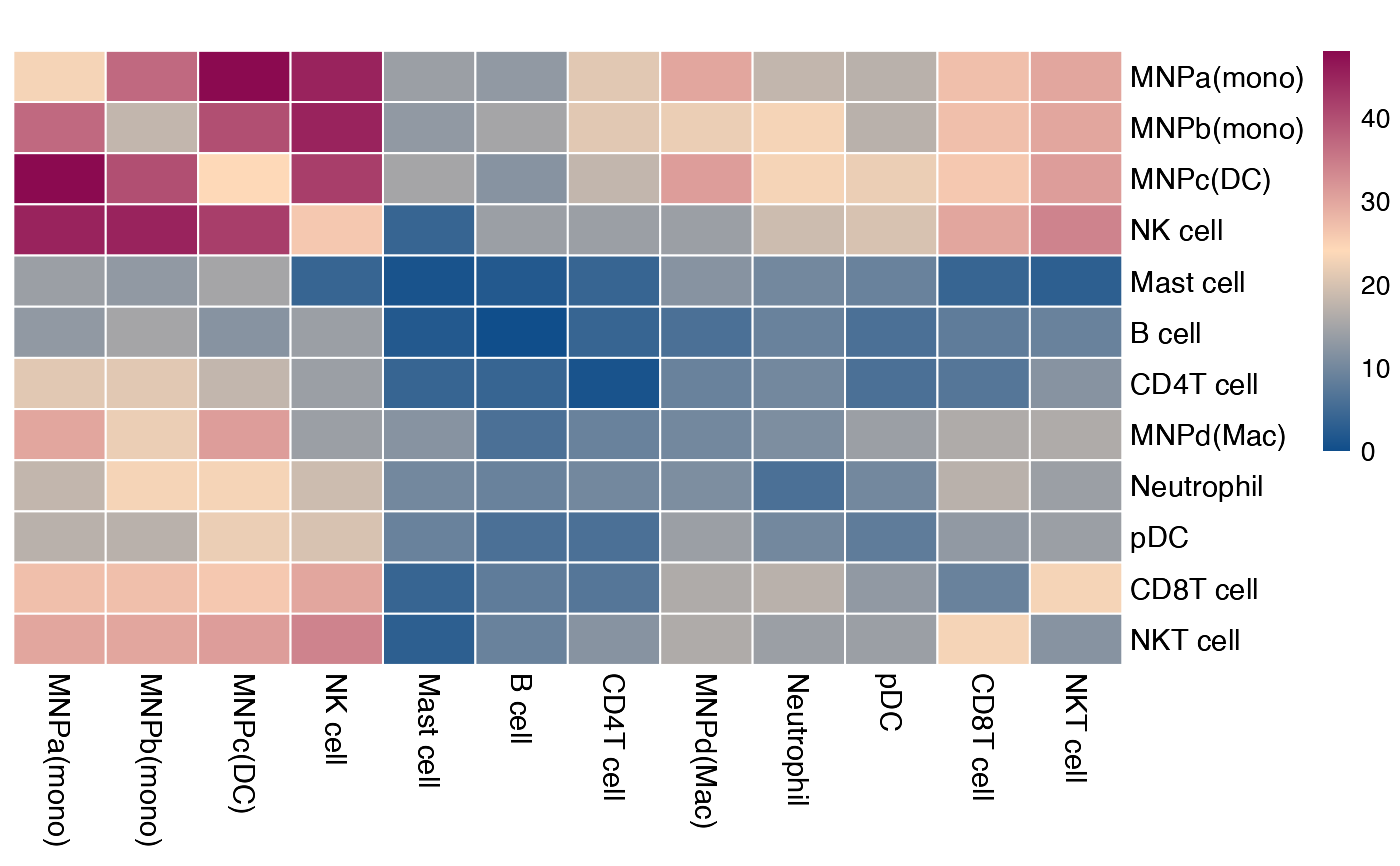
Plotting CellPhoneDB results as a heatmap
plot_cpdb_heatmap.RdPlotting CellPhoneDB results as a heatmap
plot_cpdb_heatmap(
  pvals,
  cell_types = NULL,
  degs_analysis = FALSE,
  log1p_transform = FALSE,
  show_rownames = TRUE,
  show_colnames = TRUE,
  scale = "none",
  cluster_cols = TRUE,
  cluster_rows = TRUE,
  border_color = "white",
  fontsize_row = 11,
  fontsize_col = 11,
  family = "Arial",
  main = "",
  treeheight_col = 0,
  treeheight_row = 0,
  low_col = "dodgerblue4",
  mid_col = "peachpuff",
  high_col = "deeppink4",
  alpha = 0.05,
  return_tables = FALSE,
  symmetrical = TRUE,
  default_sep = "\\|",
  ...
)
Arguments
- pvals
Dataframe corresponding to `pvalues.txt` or `relevant_interactions.txt` from CellPhoneDB.
- cell_types
vector of cell types to plot. If NULL, all cell types will be plotted.
- degs_analysis
Whether `CellPhoneDB` was run in `deg_analysis` mode
- log1p_transform
Whether to log1p transform the output.
- show_rownames
whether to show row names.
- show_colnames
whether to show column names.
- scale
scaling mode for pheatmap.
- cluster_cols
whether to cluster columns.
- cluster_rows
whether to cluster rows.
- border_color
border color.
- fontsize_row
row font size.
- fontsize_col
column font size.
- family
font family.
- main
plot title.
- treeheight_col
height of column dendrogram.
- treeheight_row
height of row dendrogram.
- low_col
low colour for heatmap.
- mid_col
middle colour for heatmap.
- high_col
high colour for heatmap.
- alpha
pvalue threshold to trim.
- return_tables
whether or not to return the results as a table rather than the heatmap
- symmetrical
whether or not to return as symmetrical matrix
- default_sep
the default separator used when CellPhoneDB was run.
- ...
passed to pheatmap::pheatmap.
Value
pheatmap object of cellphone db output